1 The Company
One homebuilder has seen intensive insider buying during the last 30 days. Intensive insider buying can be defined by the following three criteria:
The stock is purchased by three or more insiders within one month.
The stock is sold by no insiders in the month of intensive purchasing.
At least two purchasers increase their holdings by more than 10%.
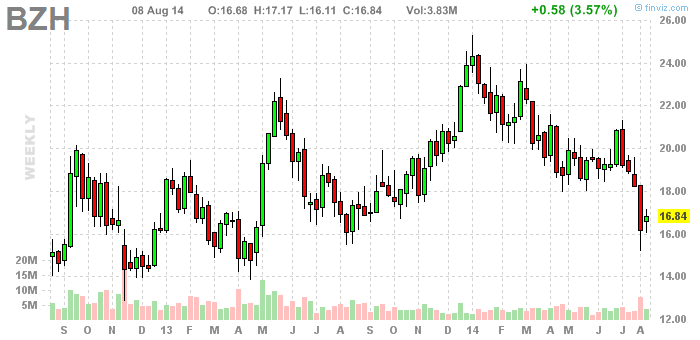
Beazer Homes USA (BZH) designs, builds, and sells single-family and multi-family homes in the United States.
| Shares outstanding | 26.4 million |
| Share price | $16.84 |
| Market cap | $445.0 million |
| Enterprise value | $1.8 billion |
| P/S | 0.3 |
| Ticker | BZH |
1.1 History
In 1696 George Beazer established the family trade in England. Beazer Homes moved to the U.S. in 1986. In March 1994 Beazer Homes had its initial public offering.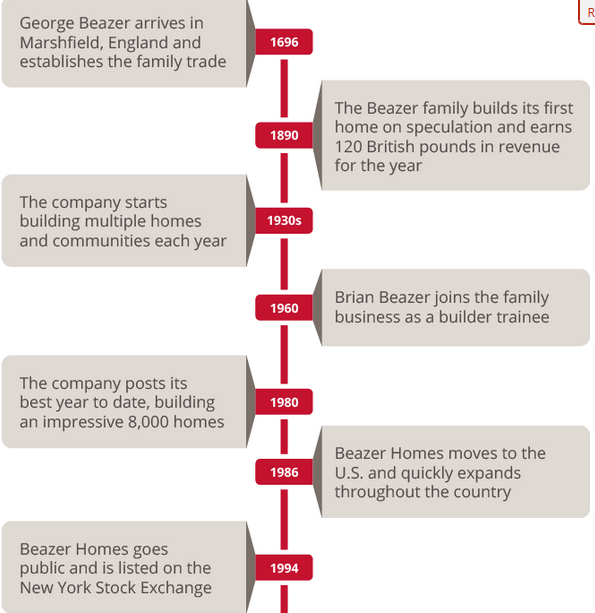
(Source: Beazer Homes)
1.2 Business Model
The company's homes are designed to appeal to homeowners at various price points across various demographic segments and are generally offered for sale in advance of their construction. Beazer Homes' objective is to provide its customers with homes that incorporate exceptional value and quality while seeking to maximize the company's return on invested capital over the course of a housing cycle.
2 Management
The CEO Allan Merrill has more than 20 years of industry experience. Allan Merrill has been CEO since January 2011.
Brian Beazer is the Chairman of the company. Mr. Beazer has been in the homebuilding and construction industry worldwide for over 50 years.
2.1 Insider Ownership
Beazer Homes' directors and executive officers own 3.0% of the company.
Here is a table of Beazer Homes' insider activity during the last 30 days.
| Name | Title | Trade Date | Shares Purchased | Current Ownership | Increase InShares |
| Elizabeth Acton | Director | Aug 5 | 1,000 | 10,560 shares | +10.5% |
| Stephen Zelnak | Director | Aug 4 | 10,000 | 46,017 shares | +27.8% |
| Laurent Alpert | Director | Aug 4 | 2,500 | 20,340 shares | +14.0% |
| Norma Provencio | Director | Aug 1 | 3,000 | 18,240 shares | +19.7% |
| Allan Merrill | CEO | Aug 1 | 10,000 | 179,941 shares | +5.9% |
| Kenneth Khoury | EVP | Aug 1 | 4,672 | 67,390 shares | +7.4% |
| Robert Salomon | CFO | Aug 1 | 7,000 | 53,462 shares | +15.1% |
| Brian Beazer | Chairman | Aug 1 | 10,000 | 63,425 shares | +18.7% |
There have been 47,172 shares purchased by insiders during the last 30 days. Six of these eight insiders increased their holdings by more than 10%.
Here is a table of Beazer Homes' insider activity by calendar month.
| Insider buying / shares | Insider selling / shares | |
| August 2014 | 48,172 | 0 |
| July 2014 | 0 | 0 |
| June 2014 | 17,000 | 0 |
| May 2014 | 0 | 0 |
| April 2014 | 0 | 0 |
| March 2014 | 0 | 0 |
| February 2014 | 0 | 0 |
| January 2014 | 0 | 0 |
| December 2013 | 0 | 0 |
| November 2013 | 0 | 0 |
| October 2013 | 0 | 0 |
| September 2013 | 0 | 0 |
| August 2013 | 0 | 0 |
| July 2013 | 0 | 0 |
| June 2013 | 0 | 0 |
| May 2013 | 0 | 0 |
| April 2013 | 0 | 0 |
| March 2013 | 0 | 0 |
| February 2013 | 0 | 0 |
| January 2013 | 0 | 0 |
There have been 65,172 shares purchased and there have been zero shares sold by insiders since January 2013.
2.2 Compensation
Here is a table of the management's compensation during the last three years.
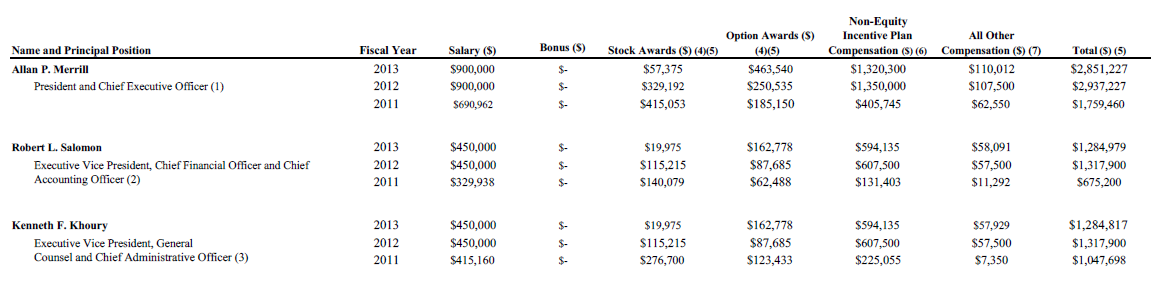
(Source: Proxy Statement)
The management's total compensation was highest in 2012.
3 Operating Summary
Here is a table of Beazer Homes' number of homes closed and average closing prices.
| Fiscal Year | Number of Homes Closed (Continuing Operations) | Average Closing Price ($ in thousands) |
| 2004 | 16,451 | 232.2 |
| 2005 | 18,109 | 271.3 |
| 2006 | 18,361 | 285.7 |
| 2007 | 12,020 | 277.4 |
| 2008 | 6,370 | 254.3 |
| 2009 | 4,196 | 230.8 |
| 2010 | 4,513 | 221.7 |
| 2011 | 3,249 | 219.4 |
| 2012 | 4,428 | 224.9 |
| 2013 | 5,056 | 253.0 |
The number of homes closed and the average closing prices have been trending higher since 2011.
4 Financial Summary
4.1 Current Situation
Beazer Homes reported the fiscal 2014 third-quarter, which ended June 30, financial results on July 31 with the following highlights:
| Revenue | $354.7 million |
| Net loss | $12.4 million |
| Cash | $206.5 million |
| Debt | $1.5 billion |
| Backlog | $663.2 million |

(Source: Investor presentation)
The revenue grew 12.8% in the quarter compared to the prior year. Beazer Homes posted net income excluding refinancing charge of $6.6 million.
4.2 Historical Developments
Here is a table of Beazer Homes' revenue and earnings since 2004.
| Fiscal Year | 2004 | 2005 | 2006 | 2007 | 2008 | 2009 | 2010 | 2011 | 2012 | 2013 |
| Revenue ($ in billions) | 3.9 | 5.0 | 5.4 | 3.5 | 1.7 | 1.0 | 1.0 | 0.7 | 1.0 | 1.3 |
| Net income / loss ($ in millions) | +235.8 | +275.9 | +368.8 | -411.1 | -951.9 | -189.4 | -34.0 | -204.9 | -145.3 | -33.9 |
| EPS (diluted) | +29.54 | +29.35 | +42.20 | -53.50 | -123.45 | -24.50 | -2.85 | -13.84 | -7.87 | -1.37 |
(Note: Beazer Homes had an 1-for-5 reverse stock split on October 11, 2012, and a 3-for-1 split on March 22, 2005. The EPS numbers have been adjusted accordingly.)
The revenue has been growing since 2011 and also the net losses have been trending lower since 2011.
5 Shares
Here is a table of Beazer Homes' number of shares since 2004.
| Year | 2004 | 2005 | 2006 | 2007 | 2008 | 2009 | 2010 | 2011 | 2012 | 2013 |
| Number of shares (basic) (in millions) | 8.3 | 8.1 | 8.0 | 7.7 | 7.7 | 7.7 | 12.0 | 14.8 | 18.5 | 24.7 |
| Number of shares (diluted) (millions) | 8.5 | 9.1 | 8.9 | 7.7 | 7.7 | 7.7 | 12.0 | 14.8 | 18.5 | 24.7 |
(Note: Beazer Homes had an 1-for-5 reverse stock split on October 11, 2012, and a 3-for-1 split on March 22, 2005. The number of shares have been adjusted accordingly.)
Beazer Homes' number of shares (diluted) have grown 191% since 2004.
6 Outlook
Beazer Homes expects its full-year GAAP net income to be above $30 million.

(Source: Investor presentation)
7 Competition
Beazer Homes' competitors include KB Home (KBH), Lennar (LEN), and PulteGroup (PHM). Here is a table comparing these companies.
| Company | BZH | KBH | LEN | PHM |
| Market Cap: | 442.59M | 1.51B | 7.47B | 6.75B |
| Employees: | 878 | 1,430 | 5,741 | 3,843 |
| Qtrly Rev Growth (yoy): | 0.13 | 0.08 | 0.28 | 0.01 |
| Revenue: | 1.36B | 2.18B | 6.70B | 5.64B |
| Gross Margin: | 0.19 | 0.19 | 0.23 | 0.23 |
| EBITDA: | 70.80M | 141.68M | 817.54M | 632.90M |
| Operating Margin: | 0.04 | 0.06 | 0.12 | 0.11 |
| Net Income: | -14.04M | 92.37M | 493.79M | 2.60B |
| EPS: | -0.28 | 0.69 | 2.23 | 6.71 |
| P/E: | N/A | 23.75 | 16.38 | 2.67 |
| PEG (5 yr expected): | 18.58 | 1.89 | 1.51 | 2.00 |
| P/S: | 0.32 | 0.68 | 1.10 | 1.17 |
Beazer Homes has the lowest P/S ratio among these four companies.
8 Valuation
Beazer Homes will have a book value above $20 per share after the removal of the valuation allowance on the company's Deferred Tax Assets.
Allan Merrill commented on the most recent earnings call:
"Finally, once we remove the valuation allowance on our DTA, which we expect to begin doing during fiscal 2015, we'll have the book value above $20 a share. With our earnings potential it seems illogical to me that we would be the only builder to trade below book value."
9 Risks
The homebuilding industry is cyclical. A severe downturn in the industry, as recently experienced, could adversely affect Beazer Homes' business, results of operations and stockholders' equity.
10 Conclusion
There have been eight different insiders buying Beazer Homes and there have not been any insiders selling Beazer Homes this month. The eight insiders purchased their shares at prices ranging from $15.97 to $16.82. I believe Beazer Homes could be a good pick below $16.82 based on the intensive insider buying.

(Source: Investor presentation)
Disclosure: The author has no positions in any stocks mentioned.
About the author:maarnioI have 15 years of investing experience. I have traded stocks, commodities and Forex markets.| Currently 0.00/51234
Subscribe to:
Post Comments (Atom)
|
No comments:
Post a Comment