The initial claims figure is compiled using data collected by local unemployment offices. Local offices pass the information to the state unemployment offices, which in turn report the data to the Department of Labor in Washington. While an applicant for unemployment insurance may not qualify to receive benefits, all applications are filed as a claim regardless of the applicant's eligibility. For this reason the new claims from one week are not always consistent with the following week's change in continuing jobless claims.
The number of jobless claims is limited in representing the number of unemployed people. Like the self-employed and contractors, many workers are not covered by the unemployment insurance system and are therefore not represented by the jobless claims release in the event that they become unemployed.
What Jobless Claims Tell Us About the Economy's Health
The job market's health is directly tied to the overall economy's health. The loss of jobs affects consumer spending, undermining the personal consumption that drives the economy. Jobless claims signal strength or weakness in nationwide job growth. Increases in jobless claims reflect slowing job growth, while decreasing claims signal accelerating job growth. Jobless claims typically rise before the economy enters a recession and fall before economic recovery.
The average number of initial claims for unemployment insurance is included in the "Composite Index of Leading Indicators," an index published monthly by the Conference Board composed of 10 economic components. The index is used to forecast the economic outlook for the near future. The jobless claims report includes the following:
Initial Claims and Volatility: The initial claims figure is often volatile and erratic. Data can become skewed, for instance, when workweeks are shortened by national holidays. A four-week moving average of new claims is published in the report, addressing the problems caused by the volatility of the weekly number. The four-week moving average figure allows analysts to track the underlying trend in claims and provides a smoother, more reliable gauge. Continuing Claims: Continuing claims show the number of unemployed individuals who qualify for and are currently receiving benefits under unemployment insurance. The data used in continuing claims lags initial claims by one week. The Insured Unemployment Rate: The report also covers the insured unemployment rate, which shows the percentage of people who do not have a job, are eligible for unemployment insurance benefits and are actively seeking work. Interpreting the Jobless Claims Report
A sustained move of at least 30,000 in claims is widely viewed as the minimum figure to signal a meaningful change in job growth.
Another benchmark number, 400,000, is used by many economists in the context of the jobless claims report. When claims rise above 400,000 for several weeks, this is seen to reflect economic weakness and signal the potential danger of falling into recession. Conversely, a number moving below 375,000 reflects a possible economic recovery, as fewer workers are being laid off by companies. A continuing claims number of greater than 3 million is considered a negative threshold by some analysts.
Market Reaction to the Jobless Claims Report
Trading opportunities can come into play when the jobless claims report misses or exceeds analyst expectations, causing market volatility. A larger divergence from analyst expectations usually translates into a larger reaction in the markets. Here are the typical, but by no means universal, reactions broken down by market:
Stocks: Jobless claims coming in higher than expected is typically bearish/negative for stocks, while a report coming in lower than expected is bullish/positive. Bonds: Jobless claims coming in higher than expected is typically bullish/positive for bonds, while a report coming in lower than expected is bearish/negative. Currencies: Jobless claims coming in higher than expected is typically bearish/negative for the U.S. dollar, while a report coming in lower than expected is bullish/positive. A Sample Report
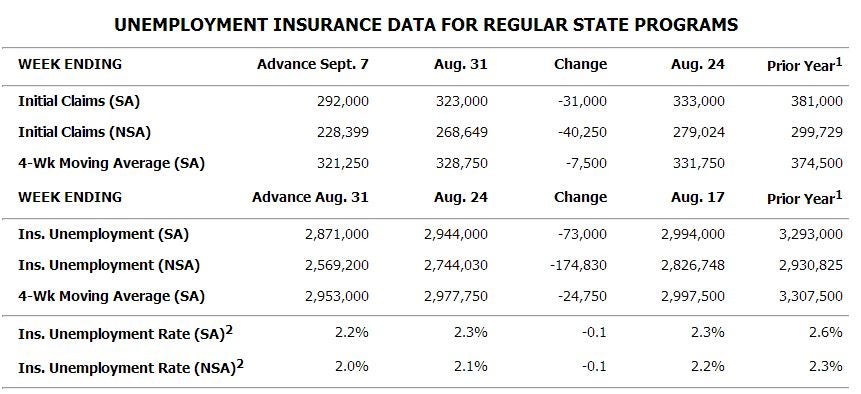
The excerpt above is from the report issued Sept. 12, 2013. It contains the most important figures from the report: initial claims, the four-week moving average of claims and continuing claims. Continuing claims is officially listed as "insured unemployment." Bear in mind that the advance figure, in this case covering the week ended Sept. 7, is often subject to revisions.
While both seasonally adjusted (SA) and not seasonally adjusted (NSA) data are shown, markets focus primarily on the seasonally adjusted numbers.
We can see that this was a modestly positive report for the labor market, with seasonally adjusted initial claims falling 31,000 to 292,000, the four-week moving average of seasonally adjusted claims falling 7,500 to 321,250 and seasonally adjusted continuing claims coming in at 2,871,000, a drop of 73,000 from the prior week.
The BLS Employment Situation Report
The jobless claims report is often used to try to gauge the outlook for the monthly Employment Situation Report. The Employment Situation Report, released on the first Friday of each month by the Bureau of Labor Statistics, stands among the most important economic releases. It includes the U.S. unemployment rate, non-farm payroll employment, average workweek and average hourly earnings.
The Bottom Line
While overshadowed in importance by the BLS monthly employment report, the freshness of the data in the jobless claims report makes it a key early indicator of labor market health. Due to the data's volatility, the four-week average is an important figure to track along with the weekly initial claims figure.
No comments:
Post a Comment