BALTIMORE (Stockpickr) -- The big indices are continuing to tread water today, extending the sideways slug that's been in effect since the calendar flipped over to March. But while the averages stay sideways, a big contingent of large-cap names is on the edge of the precipice.
I'm talking about the laggards in this market: the "toxic" stocks.
When markets are consolidating sideways, searching for big gains isn't the name of the game. Often your best trade comes from selling off the worst performers -- or shorting them.
Today, I'll show you five big names you need to unload before the next leg down.
Just to be clear, the companies I'm talking about today aren't exactly junk. By that, I mean they're not next up in line at bankruptcy court. But that's frankly irrelevant; from a technical analysis standpoint, sellers are shoving around these toxic stocks right now. For that reason, fundamental investors need to decide how long they're willing to take the pain if they want to hold onto these firms in the weeks and months ahead. And for investors looking to buy one of these positions, it makes sense to wait for more favorable technical conditions (and a lower share price) before piling in.
For the unfamiliar, technical analysis is a way for investors to quantify qualitative factors, such as investor psychology, based on a stock's price action and trends. Once the domain of cloistered trading teams on Wall Street, technicals can help top traders make consistently profitable trades and can aid fundamental investors in better planning their stock execution.
So, without further ado, let's take a look at five "toxic stocks" you should be unloading.
Commercial Metals
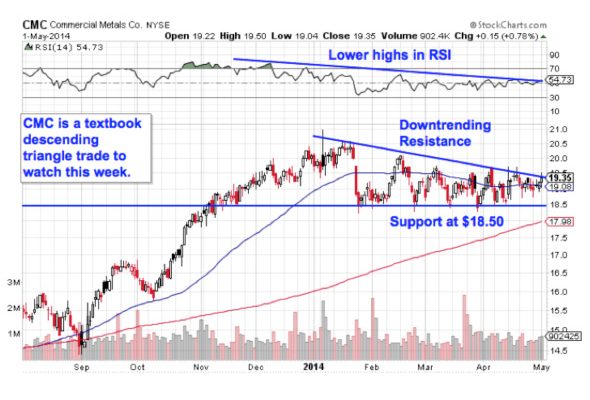
First up is Commercial Metals (CMC), a name that's sitting on the heels of a big run-up over the last year. In the trailing 12 months, CMC has rallied more than 34%, beating the S&P 500 by more than 15% over that stretch. But as 2014 wears on, CMC's chart is starting to show some cracks.
Here's how to trade it:
CMC is currently forming a descending triangle pattern, a bearish price setup that's formed by horizontal support down at $18.50 and downtrending resistance at the top of the pattern. Basically, as shares of CMC bounce in between those two key levels, this stock is getting squeezed closer and closer to a breakdown below that $18.50 support level. When that happens, we've got a sell signal.
Momentum, measured by 14-day RSI, has been trending lower since back in November. That fact adds some extra downside bias to CMC. If buyers fail to hold that price floor at $18.50, then look out below. Shorting CMC doesn't become a high probability trade until that support level gets violated.
Avago Technologies
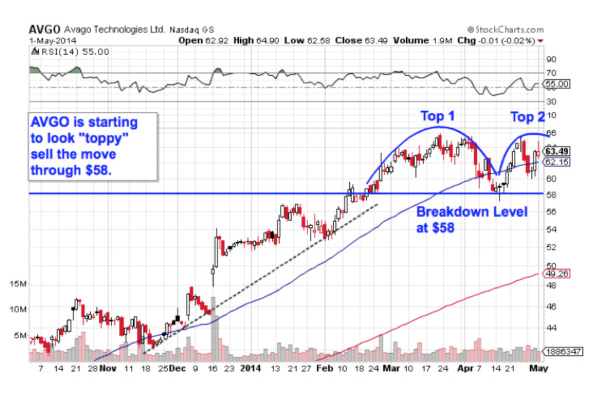
Avago Technologies (AVGO) is another name that's starting to show signs of a top after rallying hard in the last year. Avago has actually doubled since last May, making the $16 billion name one of the best performers in the semiconductor space over that stretch of time. But a double-top setup in AVGO is drawing the line in the sand for downside risk.
Avago's double-top pattern looks just like it sounds: The bearish reversal pattern is formed by two swing highs that top out around the same price level. The sell signal comes on a breakdown below the intermediate low at $58. Like CMC, this is a conditional sell. Until shares fall through that price floor at $58, there isn't a signal here.
Why the significance at $58? Whenever you're looking at any technical price pattern, it's critical to keep buyers and sellers in mind. Shapes like double tops are a good way to quickly describe what's going on in a stock, but they're not the reason it's tradable. Instead, it all comes down to supply and demand for shares.
That horizontal $58 support level in AVGO is the spot where there's previously been an excess of demand for shares; in other words, it's a price where buyers have been more eager to step in and buy shares at a lower price than sellers were to sell. That's what makes a breakdown below support so significant -- the move means that sellers are finally strong enough to absorb all of the excess demand at the at price level. So, if $58 gets taken out, you'll want to join sellers in unloading (or shorting) shares.
Teck Resources
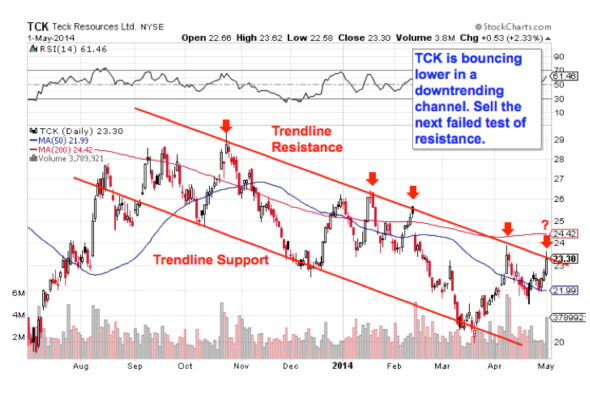
Things are a little simpler in shares of Teck Resources (TCK) right now. You don't have to be an expert technical analyst to figure out why this stock looks toxic -- a quick glance at the chart is all it takes.
That's because TCK is currently bouncing its way lower in a textbook downtrending channel. The setup is formed by a pair of parallel trendlines: a resistance line above shares, and a support line below them. Those two lines on the chart provide traders with the high-probability range for TCK's shares to stay within. This week, as Teck presses up against to the top of the channel for a fifth time, it makes sense to sell (or short) its next move lower.
Waiting for that move down before clicking "sell" is a critical part of risk management, for two big reasons: It's the spot where prices are the highest within the channel, and alternatively it's the spot where you'll get the first indication that the downtrend is ending. Remember, all trend lines do eventually break, but by actually waiting for the bounce to happen first, you're ensuring that sellers are still in control before you unload shares of TCK.
Agilent Technologies

Agilent Technologies (A) isn't a newcomer to our list of toxic names -- this $18 billion measurement equipment company was a high-probability downside trade more than a month ago. But what has changed is the pattern that's in play in Agilent -- and how much further it has to fall.
Agilent has evolved into a narrow downtrending channel, the exact same setup that's haranguing shares of Teck right now. Trend line resistance at the 50-day moving average has batted down shares on each test at that level, and so as Agilent tests resistance yet again this week, it becomes a sell again on a bounce.
If you decide to go more aggressive with a short bet against Agilent, I'd recommend keeping a protective stop on the other side of the 50-day moving average. Since that price level has been a good proxy for support, the downtrend is broken if the 50-day gets violated.
McGraw Hill Financial
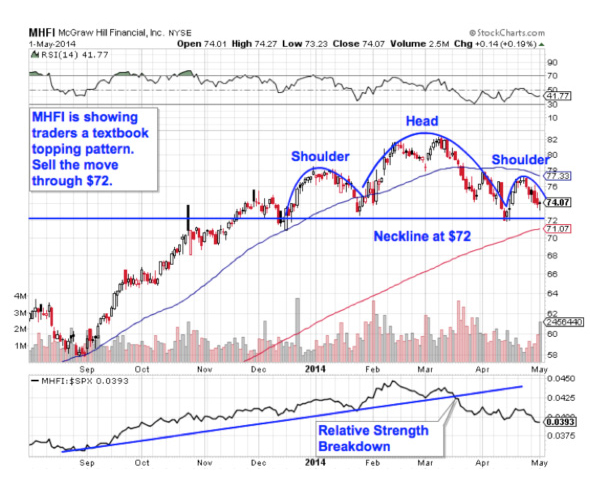
Last up is McGraw Hill Financial (MHFI), the $20 billion financial research and ratings company. MHFI is another name that's capitalized on the broad-based equity rally in the last year, climbing more than 42% since last May. But shares are showing traders a classical topping pattern in 2014 -- and that's sending a big sell signals on a breakdown below $72.
The head and shoulders pattern is formed by two swing highs that top out at approximately the same level (the shoulders), separated by a higher high (the head). The sell signal comes on a move through MHFI's neckline level at $72. This stock is within grabbing distance of that breakdown level this week.
Another indicator, relative strength (not to be confused with RSI), is the side signal that's pointing to downside in MHFI in April. While relative strength had been looking good at the start of the year, our relative performance gauge broke down in late March, sending a very negative signal for anyone who owns McGraw Hill Financial right now. If you decide to short shares, keep a protective stop just above the right shoulder at $77.50.
To see this week's trades in action, check out the Toxic Stocks portfolio on Stockpickr.
-- Written by Jonas Elmerraji in Baltimore.
RELATED LINKS:
>>4 Big Stocks on Traders' Radars
>>5 Hated Earnings Stocks You Should Love
>>4 Big-Volume Stocks in Breakout Territory
Follow Stockpickr on Twitter and become a fan on Facebook.
At the time of publication, author had no positions in stocks mentioned.
Jonas Elmerraji, CMT, is a senior market analyst at Agora Financial in Baltimore and a contributor to TheStreet. Before that, he managed a portfolio of stocks for an investment advisory returned 15% in 2008. He has been featured in Forbes , Investor's Business Daily, and on CNBC.com. Jonas holds a degree in financial economics from UMBC and the Chartered Market Technician designation.
Follow Jonas on Twitter @JonasElmerraji
No comments:
Post a Comment