Applied Materials (Nasdaq: AMAT ) reported earnings on May 16. Here are the numbers you need to know.
The 10-second takeaway
For the quarter ended April 28 (Q2), Applied Materials beat expectations on revenues and beat expectations on earnings per share.
Compared to the prior-year quarter, revenue contracted significantly. Non-GAAP earnings per share dropped significantly. GAAP earnings per share dropped to a loss.
Gross margins increased, operating margins contracted, net margins dropped.
Revenue details
Applied Materials logged revenue of $1.97 billion. The 15 analysts polled by S&P Capital IQ wanted to see net sales of $1.92 billion on the same basis. GAAP reported sales were 22% lower than the prior-year quarter's $2.54 billion.

Source: S&P Capital IQ. Quarterly periods. Dollar amounts in millions. Non-GAAP figures may vary to maintain comparability with estimates.
EPS details
EPS came in at $0.16. The 17 earnings estimates compiled by S&P Capital IQ averaged $0.13 per share. Non-GAAP EPS of $0.16 for Q2 were 41% lower than the prior-year quarter's $0.27 per share. GAAP EPS were -$0.11 for Q2 against $0.22 per share for the prior-year quarter.
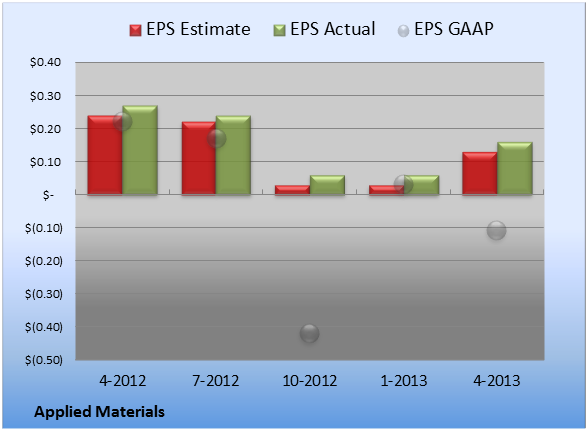
Source: S&P Capital IQ. Quarterly periods. Non-GAAP figures may vary to maintain comparability with estimates.
Margin details
For the quarter, gross margin was 41.0%, 120 basis points better than the prior-year quarter. Operating margin was 11.2%, 660 basis points worse than the prior-year quarter. Net margin was -6.5%, much worse than the prior-year quarter. (Margins calculated in GAAP terms.)
Looking ahead
Next quarter's average estimate for revenue is $2.05 billion. On the bottom line, the average EPS estimate is $0.19.
Next year's average estimate for revenue is $7.81 billion. The average EPS estimate is $0.64.
Investor sentiment
The stock has a four-star rating (out of five) at Motley Fool CAPS, with 2,001 members out of 2,117 rating the stock outperform, and 116 members rating it underperform. Among 435 CAPS All-Star picks (recommendations by the highest-ranked CAPS members), 417 give Applied Materials a green thumbs-up, and 18 give it a red thumbs-down.
Of Wall Street recommendations tracked by S&P Capital IQ, the average opinion on Applied Materials is outperform, with an average price target of $14.58.
Can your portfolio provide you with enough income to last through retirement? You'll need more than Applied Materials. Learn how to maximize your investment income and "Secure Your Future With 9 Rock-Solid Dividend Stocks." Click here for instant access to this free report.
Add Applied Materials to My Watchlist.
No comments:
Post a Comment